BEYOND THE CLICK: MEASURING DIGITAL MARKETING EFFECTIVENESS WITH DATA THAT MATTERS
Beyond the Click is a series of blogs penned by Ryan Winfield, our Senior Digital Strategy Manager. Intended to identify ways to use data to improve the results of your marketing, these articles will identify just how much impact can be made by tracking what truly matters, not just clicks.
PART ONE
Tracking Your Money Pages
You’ve invested in your digital campaign, whether it’s self-managed or through a marketing agency. You have the reasonable expectation that your campaign would drive users, engagement, and conversion across your website. You may have even had your agency report back to you that it “worked” because of a high click through rate, or an increase in period-over-period traffic to the site. However, you, as the marketing director, are responsible for making your best effort to translate that into a conversation of ROI and convey that to other key members of your company. What can you look for in your own data to help measure true campaign effectiveness, and tell that story within the organization? Every marketer has been there, and the most successful ones understand how to convey the true impact of the work they are doing using this data.
In this post, we’ll dig into your website’s “money” pages – what content on your site is vital to actual revenue growth– and how tracking trends on those key pages illuminates campaign purpose and optimizations differently. Drilling down to methods and secondary dimensions of Google Analytics will make a difference.
Real work example
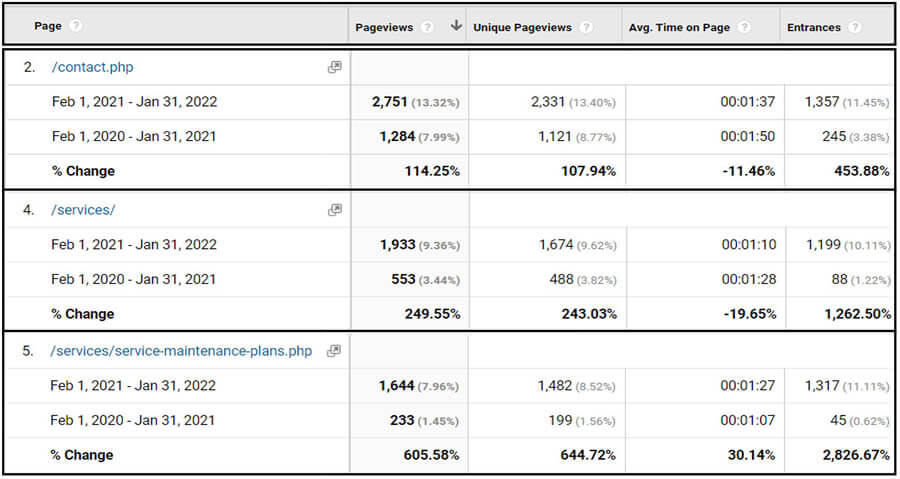
For this illustration, we’ll be using live screen shots of a major, Michigan-wide industrial mechanical contractor, that has invested in targeted branding and search efforts for the last year. Before the campaign launch, the client advised that the service overview page, service maintenance plans, and the contact page were the most important content pages on their site. (No matter the industry, the contact page will be a key page for nearly every company with a website.)
After launching a digital marketing campaign for our client, with components of branding display, pay-per-click search, and remessaging, here are the results year-over-year:

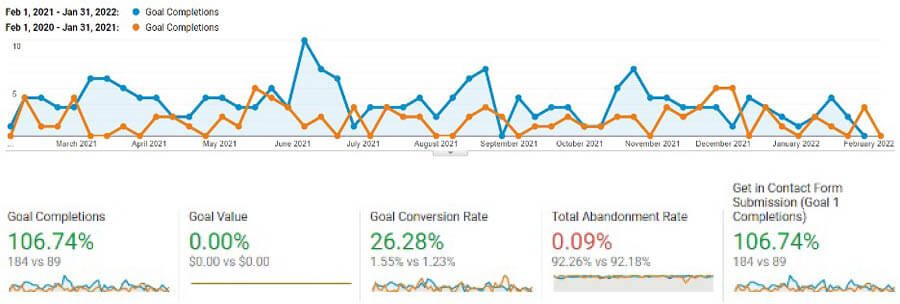
Luckily, this client also has had goal conversions set up on their site for years prior to the campaign launch, so we were able to measure what we refer to as “hard” conversions – leads from their prospects – which resulted in a 106% increase year-over-year in leads generated by the website.

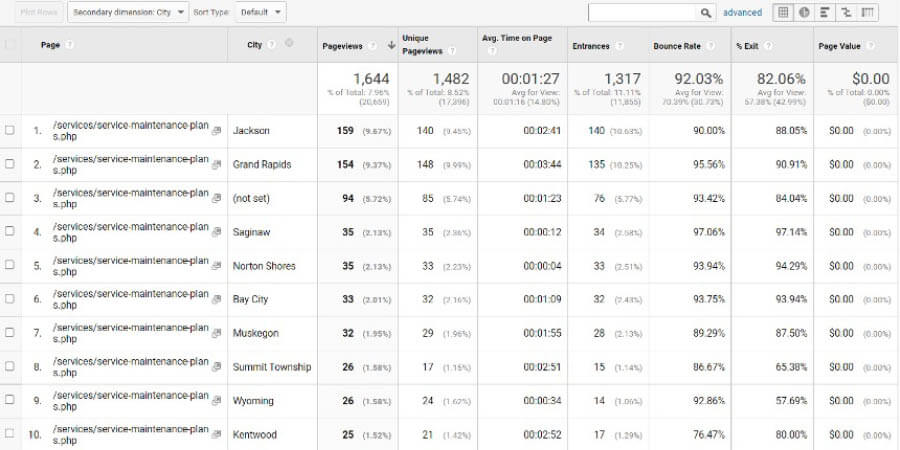
It’s also valuable to look at secondary dimensions while in Google Analytics, especially at the site content/page level. As you can see below, every one of the top 10 cities that trafficked the “Service Maintenance” page are from within the client’s service area, across all traffic sources. Utilizing secondary dimensions, you can see traffic to key pages allocated by source, medium, geography, new vs. return users, and much more. It’s worth experimenting with this tool in your own Analytics, to come to a deeper understanding of how users interact with your content.

After a full year of campaign performance, and monthly reporting and optimization meetings where additional data deep dives take place, the client has experienced a booming period of growth for leads, quotes, and completed jobs across the state. The campaign has performed on an exceptional level by paying attention to the data, and not simply resting on such an easy metric such as clicks, or sessions.

Contributed by Ryan Winfield, Senior Digital Strategy Manager


 Ad Choices
